Research article
Infraspecific morphological variations of
Salvia limbata in Iran
S.M. Talebi1*, P. Yadegari1, S. Behzadpour1, A. Matsyura2
1Department of Biology, Faculty of Sciences, Arak University
Arak, 38156‒8‒8349 Iran. Phone: 098‒863‒4173317.
2Altai State University, Lenin St. 61, Barnaul, Russian Federation, E-mail: amatsyura@gmail.com
*Corresponding author E‒mail: seyedmehdi_talebi@yahoo.com

Salvia limbata is an aromatic herb of Lamiaceae, which distributed in different parts of Iran. Studies have revealed that this species has several benefit compounds for human health. In this study, we investigated infra‒specific morphological difference in this species. In total, 21 inflorescence morphological features were evaluated in eight populations; ten individuals were evaluated per each population. Data were analysed using SPSS and MVSP softwares. Morphological traits highly differed among the studied populations and ANOVA test revealed significant differences among most of them. According to UPGMA tree, PCA and PCO plots of morphological characteristics, we reported four distinct phenotypes among the studied populations. CA. Joined plot revealed each of these group were characterized by special traits, which were useful in identification of them. Two phenotypes were monotypic, while the rest were composed of two to four populations. This species has a relative large geographical distribution, the distribution of its populations in diverse area will prevent the focus of natural selection in a given direct. Therefore different phenotypes were found in its different populations.
Key words: morphology; population; phenotype; S. limbata

Introduction
In nature, the creation of infra‒specific difference can occur through a wide range of mechanisms such as local adaptation, phenotypic plasticity, parental conditions and artificial selection (Violle et al., 2012). West‒Eberhard (1989) has believed that when it is resulted from plasticity, features can differ rapidly within generations and vary drastically across populations in dissimilar habitats. Recently, studies have broadened in the identification of variation to incorporate the considerable phenotypic difference within and among populations of the same species (Violle et al., 2012).
Investigations have showed that difference of phenotypic feature within species can be as extreme as the characteristic difference across species (Albert et al., 2010). Moreover, infra‒specific difference may influence structure of community and function of ecosystem as much as difference among species (Govaert, Pantel, & De Meester, 2016; Palkovacs & Post, 2009).
Salvia limbata is an aromatic herb of Lamiaceae that grows naturally in various regions of Iran and some neighboring countries (Guner, Ozhatay, Ekim, & Baser, 2000; Rechinger, 1982). Different flavone compounds such as ladanein, salvigenin, luteolin 7‒methyl ether, cirsiliol, eupatorin, luteolin 7‒O‒glucoside and rosmarinic acid were isolated from extracts of this plant (Gohari, Saeidnia, Malmir, Hadjiakhoondi, & Ajani, 2010). Moreover, Saeidnia, Gohari, Malmir, Moradi‒Afrapoli, & Ajani (2011) have suggested that S. limbata can accumulate tryptophan, sterols and their glucosides, therefore, consumption of this plant as an herbal tea or other preparations might be useful for dietary deficiency of this amino acid. In mice, S. limbata has beneficial effects to decrease dependence sign produced by morphine and increase in pain threshold compared with the control (Alemy, Karami, Hossini, Ebrahimzadeh, & Shahbi‒Majd, 2012).
Although, comparative infraspecific anatomical (Nejadhabibvash, Rezaei‒Chiyaneh, & Pirzad, 2017) and phytochemical studies (Mirza, Mozaffarian, & Nik, 2005; Kurkcuoglu et al., 2005) have been performed in this species, as far we could search, no infra‒specific morphological investigation is available for its populations.
In current study, we studied morphological characteristics of inflorescence in eight populations of S. limbata, in order to evaluate pattern of morphological variations among the populations and also find possible phenotype(s) among the studied populations.
Material and methods
Morphological studies
In current study, eight natural populations of S. limbata were harvested from different regions of the country (Table 1), and were identified according to descriptions provided in Flora of Iran (Jamzad, 2012). Morphological differences were carefully evaluated for reproductive organs from collected samples of the studied populations. The morphological characteristics of flowers were studied under dissecting stereo microscopes. For morphometric analysis, 80 plant specimens from 8 populations were used. Voucher specimens were deposited at Herbarium of Arak University.
Table 1. Locality address of the studied populations of S. limbata
coding |
Locality address |
1 |
Markazi province, arak, Sardasht, 1850 m. |
2 |
Markazi province, Saveh, Sangak, 1940 m. |
3 |
Khorasan Razavi, Semnan to Ghochan, 1730 m. |
4 |
Markazi province, Zarandiyeh, Vidar, 1750 m. |
5 |
Semnan province, Ahovan, 1720 m. |
6 |
Markazi province, Zarandiyeh, 1430 m. |
7 |
Semnan province, Ghochan to Semnan |
8 |
Tehran province, Gajroud, 1600 m. |
Character measurements
Measurements of morphological traits were performed on each plant, including its flowering stem with flowers in bloom. In total, 21 qualitative features were measured on each specimen. Each character was measured four times per each plant sample, and their average determined. The studied characteristics were: calyx width, length and calyx length / width ratio, petal length, width and petal length / wide ratio, calyx short teeth length, calyx short teeth width, calyx short teeth length / width ratio, style length, stigma length, calyx long teeth length, calyx long teeth width, calyx long teeth length / width ratio, anther length, anther width, anther length /width ratio, pedicle length, long filament length, short filament length, long /short filament length ratio.
Statistical analyses
Morphometric data was subjected to one‒way analysis of variance (ANOVA) to determine if significant difference existed among populations for each feature measured. Mean and standard deviations of characteristics were tacalculated. These analyses were performed using SPSS ver. 17. Cluster analysis was carried out based on quantitative features using UPGMA, PCO, PCA and C.A‒Joined plots clustering in Multivariate Statistical Package (MVSP) program (Podani, 2000).
Results
The mean and standard deviation of the studied morphological variables were presented in Table 2.
Table 2. Mean and standard deviations of some morphological characteristics of studied populations (all values are in mm).
Population |
Anther length |
Antler width |
Pedicle
length |
Stigma length |
Style length |
Short Filament length |
Long filament length |
Petal length |
Petal width |
calyx Short teeth length |
calyx Short teeth width |
calyx long teeth length |
calyx long teeth width |
Calyx length |
Calyx width |
1 |
Mean |
4.00 |
2.00 |
5.50 |
2.90 |
19.60 |
2.70 |
3.90 |
9.80 |
5.00 |
2.00 |
0.14 |
2.60 |
0.30 |
9.90 |
7.00 |
N |
10 |
10 |
10 |
10 |
10 |
10 |
10 |
10 |
10 |
10 |
10 |
10 |
10 |
10 |
10 |
SD |
0.47 |
0.00 |
1.17 |
0.31 |
5.12 |
0.48 |
0.56 |
4.34 |
0.66 |
0.00 |
0.05 |
0.51 |
0.00 |
1.79 |
1.69 |
2 |
Mean |
5.10 |
2.00 |
1.90 |
2.65 |
19.70 |
2.80 |
3.55 |
12.50 |
5.10 |
1.15 |
0.94 |
2.50 |
1.25 |
9.70 |
7.00 |
N |
10 |
10 |
10 |
10 |
10 |
10 |
10 |
10 |
10 |
10 |
10 |
10 |
10 |
10 |
10 |
SD |
0.31 |
0.00 |
0.73 |
0.24 |
2.71 |
0.34 |
0.49 |
2.32 |
0.56 |
0.47 |
0.63 |
0.74 |
0.54 |
0.82 |
0.81 |
3 |
Mean |
4.80 |
2.00 |
5.60 |
2.45 |
17.40 |
2.45 |
3.35 |
11.60 |
4.50 |
0.66 |
0.36 |
1.90 |
0.82 |
9.00 |
6.70 |
N |
10 |
10 |
10 |
10 |
10 |
10 |
10 |
10 |
10 |
10 |
10 |
10 |
10 |
10 |
10 |
SD |
0.34 |
0.00 |
0.84 |
0.28 |
1.34 |
0.43 |
0.47 |
1.83 |
0.52 |
0.41 |
0.28 |
0.61 |
0.47 |
0.66 |
0.82 |
4 |
Mean |
4.55 |
2.00 |
4.05 |
1.90 |
20.60 |
2.80 |
3.60 |
12.50 |
4.80 |
0.50 |
0.43 |
2.35 |
0.64 |
8.90 |
7.10 |
N |
10 |
10 |
10 |
10 |
10 |
10 |
10 |
10 |
10 |
10 |
10 |
10 |
10 |
10 |
10 |
SD |
0.59 |
0.00 |
0.95 |
0.61 |
6.23 |
0.25 |
0.51 |
3.53 |
0.42 |
0.35 |
0.24 |
1.00 |
0.20 |
0.87 |
0.73 |
5 |
Mean |
5.20 |
2.10 |
2.20 |
2.05 |
14.60 |
2.00 |
2.75 |
8.10 |
3.70 |
0.64 |
0.33 |
2.75 |
0.20 |
9.00 |
4.45 |
N |
10 |
10 |
10 |
10 |
10 |
10 |
10 |
10 |
10 |
10 |
10 |
10 |
10 |
10 |
10 |
SD |
0.42 |
0.31 |
0.91 |
0.76 |
0.51 |
0.66 |
0.35 |
1.44 |
0.48 |
0.30 |
0.21 |
0.67 |
0.14 |
0.66 |
1.42 |
6 |
Mean |
4.70 |
2.00 |
4.50 |
1.95 |
18.50 |
2.90 |
3.85 |
11.60 |
5.00 |
0.68 |
0.28 |
2.45 |
0.36 |
8.70 |
7.00 |
N |
10 |
10 |
10 |
10 |
10 |
10 |
10 |
10 |
10 |
10 |
10 |
10 |
10 |
10 |
10 |
SD |
0.48 |
0.00 |
0.84 |
0.59 |
3.86 |
0.21 |
0.33 |
1.26 |
0.47 |
0.34 |
0.16 |
0.72 |
0.24 |
0.48 |
0.81 |
7 |
Mean |
4.90 |
2.10 |
4.80 |
2.60 |
17.20 |
2.70 |
3.38 |
10.90 |
5.20 |
0.23 |
0.27 |
1.01 |
0.38 |
7.80 |
6.10 |
N |
10 |
10 |
10 |
10 |
10 |
10 |
9 |
10 |
10 |
10 |
10 |
10 |
10 |
10 |
10 |
S. |
0.21 |
0.31 |
1.03 |
0.45 |
2.14 |
0.34 |
0.48 |
1.44 |
0.42 |
0.12 |
0.18 |
0.44 |
0.19 |
1.61 |
0.56 |
8 |
Mean |
4.75 |
2.20 |
2.80 |
2.30 |
17.10 |
2.40 |
3.20 |
10.40 |
4.90 |
0.45 |
0.42 |
2.95 |
0.92 |
9.20 |
7.40 |
N |
10 |
10 |
10 |
10 |
10 |
10 |
10 |
10 |
10 |
10 |
10 |
10 |
10 |
10 |
10 |
SD |
0.42 |
0.42 |
0.63 |
0.53 |
2.99 |
0.39 |
0.42 |
2.41 |
0.87 |
0.47 |
0.34 |
1.14 |
0.69 |
1.39 |
0.69 |
Morphological traits differed among the studied populations. Biggest and smallest anther lengths were recorded in population no. 5 and 1, respectively. While, reverse pattern were recorded for long filament length. Therefore, largest and shortest long filament lengths were reported for populations no. 1 and 5, respectively. Maximum and minimum lengths of pedicle were belonged to population’s no. 3 and 2, respectively. Largest stigma was observed in population no. 1, but population no. 4 had smallest stigma. Longest style was found in population no. 4, and shortest in population no. 5. Maximum and minimum petal lengths were registered in populations no. 5 and 2, respectively. Population no. 1 had longest calyx and widest calyx short teeth; however, shortest calyx and narrowest calyx short teeth were belonged to population no. 7. Largest and smallest short filament length was found in populations no. 6 and 5, respectively (Fig. 1).
Fig. 1. Image of Salvia limbata and its reproductive organs. A) Flowering stem, B) inflorescence cycle, C) lateral view of flower, D) calyx, E) fertile and sterile anther, F) stigma, style and ovary.
Furthermore, the ANOVA test confirmed significant variations (p ≤ 0.01) for all studied variables, except for anther width (Table 3).
Table 3. Results of ANOVA test of quantitative morphological features among the populations
characteristics |
|
Sum of Squares |
df |
Mean Square |
F |
Sig. |
Anther length |
Between Groups |
9.573 |
9 |
1.064 |
5.741 |
0.000 |
Within Groups |
16.675 |
90 |
0.185 |
|
|
Total |
26.248 |
99 |
|
|
|
Anther width |
Between Groups |
1.010 |
9 |
0.112 |
1.836 |
0.072 |
Within Groups |
5.500 |
90 |
0.061 |
|
|
Total |
6.510 |
99 |
|
|
|
Anther length/width ratio |
Between Groups |
2.387 |
9 |
0.265 |
3.696 |
0.001 |
Within Groups |
6.457 |
90 |
0.072 |
|
|
Total |
8.844 |
99 |
|
|
|
Pedicle length |
Between Groups |
171.202 |
9 |
19.022 |
22.698 |
0.000 |
Within Groups |
75.425 |
90 |
0.838 |
|
|
Total |
246.628 |
99 |
|
|
|
Stigma length |
Between Groups |
10.962 |
9 |
1.218 |
5.420 |
0.000 |
Within Groups |
20.225 |
90 |
0.225 |
|
|
Total |
31.187 |
99 |
|
|
|
Style length |
Between Groups |
277.690 |
9 |
30.854 |
2.654 |
0.009 |
Within Groups |
1046.500 |
90 |
11.628 |
|
|
Total |
1324.190 |
99 |
|
|
|
Short Filament length |
Between Groups |
6.772 |
9 |
0.752 |
4.463 |
0.000 |
Within Groups |
15.175 |
90 |
0.169 |
|
|
Total |
21.947 |
99 |
|
|
|
Long filament length |
Between Groups |
11.089 |
9 |
1.232 |
6.199 |
0.000 |
Within Groups |
17.689 |
89 |
0.199 |
|
|
Total |
28.778 |
98 |
|
|
|
Petal length |
Between Groups |
171.200 |
9 |
19.022 |
3.524 |
0.001 |
Within Groups |
485.800 |
90 |
5.398 |
|
|
Total |
657.000 |
99 |
|
|
|
Petal width |
Between Groups |
18.840 |
9 |
2.093 |
6.587 |
0.000 |
Within Groups |
28.600 |
90 |
0.318 |
|
|
Total |
47.440 |
99 |
|
|
|
Petal length/width ratio |
Between Groups |
4.134 |
9 |
0.459 |
2.408 |
0.017 |
Within Groups |
16.975 |
89 |
0.191 |
|
|
Total |
21.109 |
98 |
|
|
|
Calyx Short teeth length |
Between Groups |
22.404 |
9 |
2.489 |
13.065 |
0.000 |
Within Groups |
17.148 |
90 |
0.191 |
|
|
Total |
39.552 |
99 |
|
|
|
Calyx Short teeth width |
Between Groups |
4.532 |
9 |
0.504 |
6.069 |
0.000 |
Within Groups |
7.468 |
90 |
0.083 |
|
|
Total |
12.000 |
99 |
|
|
|
Calyx Short teeth length/width ratio |
Between Groups |
2290.906 |
9 |
254.545 |
11.111 |
0.000 |
Within Groups |
2038.907 |
89 |
22.909 |
|
|
Total |
4329.813 |
98 |
|
|
|
Calyx long teeth length |
Between Groups |
41.789 |
9 |
4.643 |
8.759 |
0.000 |
Within Groups |
47.709 |
90 |
0.530 |
|
|
Total |
89.498 |
99 |
|
|
|
Calyx long teeth width |
Between Groups |
11.206 |
9 |
1.245 |
9.699 |
0.000 |
Within Groups |
11.554 |
90 |
0.128 |
|
|
Total |
22.760 |
99 |
|
|
|
Calyx long teeth length/width ratio |
Between Groups |
31225.271 |
9 |
3469.475 |
11.935 |
0.000 |
Within Groups |
26163.531 |
90 |
290.706 |
|
|
Total |
57388.802 |
99 |
|
|
|
Calyx length |
Between Groups |
84.810 |
9 |
9.423 |
6.812 |
0.000 |
Within Groups |
124.500 |
90 |
1.383 |
|
|
Total |
209.310 |
99 |
|
|
|
Calyx width |
Between Groups |
106.462 |
9 |
11.829 |
10.622 |
0.000 |
Within Groups |
100.225 |
90 |
1.114 |
|
|
Total |
206.688 |
99 |
|
|
|
calyx length/width ratio |
Between Groups |
7.300 |
9 |
0.811 |
10.565 |
0.000 |
Within Groups |
6.910 |
90 |
0.077 |
|
|
Total |
14.211 |
99 |
|
|
|
The studied populations were clustered separately in UPGMA tree (Fig. 2); moreover, PCA and PCO (Fig. 3, 4) plots produced similar outputs.
Fig. 2. UPGMA tree of the studied populations based on morphological variables.
Fig. 3. PCO plot of the studied populations of S. limbata based on morphological features.
Therefore, population’s arrangement in the tree was discussed here. The tree had two branches: we found population no. 1 in small branch, while other populations were observed in large branch, which was divided into two sub‒branches. Population no. 5 placed far from others in a sub‒branch and the rest populations were registered in another sub‒branch into two groups. Populations no. 2 and 4 were observed as a pair. Eventually, in the other sub‒group populations no. 3 and 6 were close together and populations no. 7 and 8 gradually joined them. Therefore, we had four distinct morphological groups among the studied populations.
Fig.4. PCA plot of the studied populations based on morphological characteristics.
CA. joined plot (Fig.5) revealed each of these groups were characterized by special features that were useful in identification of them. For example, calyx length, calyx short teeth length and calyx long teeth length were prominent variables for populations no.1. Moreover, populations no. 2 and 4 were characterized by style length, calyx short teeth length/width ratio and calyx long teeth length/width ratio. Populations no. 5 was identified according to calyx length/width ratio.
Discussion
In this research, we evaluated morphological variables of inflorescence in the selected populations of S. limbata. Because, these characteristics are more stable than vegetative characteristics (Stace, 1989), in addition, Jamzad (2012) used inflorescence characteristics along with palynological as well as ITS data in her valuable work on Iranian Lamiaceae species, Flora of Iran.
Morphological features highly varied among the studied populations. Furthermore, previous studies have showed phytochemical and anatomical variations among various populations of S. limbata. For example, Mirza et al. (2005) identified germacrene D (25.7%), linalool (17.5%) and linalyl acetate (16.1%) as the major components of essential oil in Iranian population of S. limbata, while in Turkey samples ᾳ‒pinene (11.2–24.3%), β‒pinene (10.0–20.9%), and sabinene (14.6–17.4%) were the major compounds (Kurkcuoglu et al., 2005). As observed, the type and amount of major essential oil compounds were completely different between these populations. Moreover, Nejadhabibvash et al. (2017) studied effect of ecological gradients on S. limbata anatomical traits. Several quantitative anatomical characteristics related to cuticle, collenchymas, pith, phloem, xylem, stomata frequency, epidermal number and stomata length/ width ratio differed among populations.
Findings of these investigations showed high level of infra‒specific variability in S. limbata. There are some reasons for morphological variations among these populations. It seems that genetic variations and ecological conditions of habitat are more important than others are. Several studies (Talebi, Atri, Sheidai, Sharifnia, & Noormohammadi, 2014, Sheidai et al., 2014) have revealed that infra‒specific genetic variation among populations leads to morphological difference. In addition, ecological factors have strong effect on morphological characteristics and through phenotype plasticity process lead to infraspecific morphological variations (Talebi, Rezakhanlou, & Matsyura, 2017).
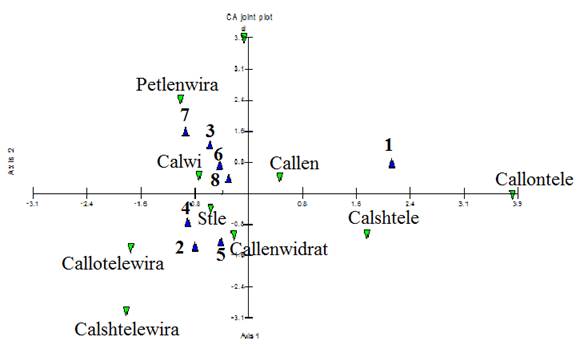
Fig. 5. CA‒Joined plot of the studied populations with morphological characteristics. Abbreviations: blue symbols are population’s number according to tables 1, calwi: calyx width, callen: calyx length, stle: style length, calshtele: calyx short teeth length, callontele: calyx long teeth length, callenwidrat: calyx length/width ratio, callotelewira: calyx long teeth length /width ratio, calshtelewira: calyx short teeth length /width ratio, petlenwira: petal length /width ratio.
According to UPGMA tree, PCA and PCO plots of morphological characteristics, we found four primitive phenotypes among these populations: phenotype no. 1(population no. 1), phenotype no. 2 (population no. 5), phenotype no. 3 (populations no. 2 and 4), and phenotype no. 4 (including the rest populations). Each phenotype was characterized by special morphological characteristics.
S. limbata has large distribution range in Iran and grows in environmental heterogeneity habitats. Its populations achieve adaptations for living under different ecological conditions, therefore phenotype plasticity occurs in order to adaptation with ecological conditions.
Wherever the population’s habitats are the same, the morphological characteristics of populations will be similar, regardless of geographical distance of populations. Studies of population on the pattern of variation in several plant species have revealed the existence of localized populations each adapted to the particular environmental conditions of their habitat (Bradshaw, 1991).
Phenotype no.3 had two populations. The habitats of these populations were close together with similar ecological conditions; therefore, morphological similarity of them was very probable. Moreover, low geographical distance facilitates gene flow between populations and leads to lower differentiation. Hamrick and Godt (1989) have suggested that higher inter‒populational gene flow leads to lower differentiation among populations.
Phenotype no. 4 consisted of four populations. The distance between populations no. 3 and 6 was more than 700 km. In addition, it was ca 350 km between populations no. 7 and 8. Contrary with very large geographical distance these populations were clustered as a group. Moreover, in comparison to phenotype no. 3, phenotype no. 2 was less distant with phenotype no. 4, while according to UPGMA tree, PCO and PCA plots phenotype 3 was closer to phenotype no. 4 rather than phenotype no. 2.
These authors propose two main possible reasons for this similarity, despite the existence of a long geographical distance. The genetic similarity is the first possible case, Sheidai et al. (2014) have suggested that the morphological similarity among populations may be due to genetic likeness, although, it is more important to know that phenotype and genotype are not necessarily tightly linked. For example, Liston (1992) and Whitkus (1992) have revealed high levels of genetic variations among morphologically similar populations of Astragalus sect. Leptocarpi and Carex pachystach, respectively.
What, unlike the long distance, has led to the similarity of populations is similarity of ecological conditions of habitats. This is well suited to the idea of ecological mosaic. Jain and Bradshaw (1966) have suggested that if a plant species encounters a mosaic of habitats while expanding its range, the selective influences of each habitat act in turn upon the whole available morphologic difference.
Talebi et al. (2014) studied morphological and ecological features of several populations of Linum album in Iran. They found that there is a strong relationship between morphology of populations and their ecological conditions. Wherever the ecological conditions were similar, the morphological characteristics of the plants were alike.
So, it seems that in the case of our studied populations, ecological factors have a very strong effect on population’s similarity or difference. This condition creates morphological polymorphism among populations. Of course, this situation gives the species that has the genetic background to occupy a variety of environments and emergence of morphological polymorphism.
Conclusion
We evaluated inflorescence morphological characteristics among eight populations of S. limbata. Morphological traits highly differed among the populations and ANOVA test revealed significant difference among the populations. According to UPGMA tree, PCA and PCO plots, we found four primitive phenotypes, which were characterized by special morphological features. Two phenotypes were monotypic, while one phenotype consisted of two, and another one has four populations. The distribution domain of a species is not composed exactly identical ecological environments, but also a set of different environment with different ecological conditions. So species must adapt its phenotype structure in accordance with those conditions in order to be able to live under those conditions.
References
Albert, C.H., Thuiller, W., Yoccoz, N.G., Douzet, R., Aubert, S., & Lavorel, S. (2010). A multi‒trait approach reveals the structure and the relative importance of intra‒ vs. interspecific variability in plant traits. Functional Ecology, 24, 1192–1201. https://doi.org/10.1111/j.1365-2435.2010.01727.x
Alemy, S.H., Karami, M., Hossini, E., Ebrahimzadeh, M.A., & Shahbi‒Majd, N. (2012). Antinociceptive activity and effect of methanol extract of Salvia limbata on withdrawal syndrome in mice. European Review for Medical and Pharmacological Sciences, 16, 38‒42.
Bradshaw, A.D. (1991). Genostasis and the limits to evolution. Philosophical Transactions of the Royal Society of London. Series Biological Sciences, 333, 289‒305.
Hamrick, J.L., & Godt, M. J.W. (1989). Allozyme diversity in plant species. Pp. 43‒63 in Plant population genetics, breeding, and genetic resources (Eds). Brown, A.H.D., Clegg, M.T., Kahler, A.L., and Weir, B.S. Sunderland, Massachusetts: Sinauer.
Gohari, A.R., Saeidnia, S., Malmir, M., Hadjiakhoondi, A., & Ajani, Y. (2010). Flavones and rosmarinic acid from Salvia limbata. Natural Product Research, 24(20), 1902–1906. https://doi.org/10.1080/14786411003766912
Govaert, L., Pantel, J. H., & De Meester, L. (2016). Eco‒evolutionary partitioning metrics: assessing the importance of ecological and evolutionary contributions to population and community change. Ecology Letters, 19, 839–853. https://doi.org/10.1111/ele.12632
Guner, A., Ozhatay, N., Ekim, T., & Baser, K.H.C. (2000). Flora of Turkey and the East Aegean Islands (11). Edinburgh University Press. Edinburgh.
Jamzad, Z. 2012. Flora of Iran. No. 76, Lamiaceae. Research Institute of Forest and Rangelands, Tehran, Iran.
Jain, S.K., & Bradshaw, A.D. (1966). Evolutionary divergence among adjacent plant populations. I. The evidence and its theoretical analysis. Heredity, 21, 407‒441. https://doi.org/10.1038/hdy.1966.42
Kurkcuoglu, M., Demirci, B., Baser, K. H. C., Dirmenci, T., Tumen, G., & Ozgen, U. (2005). The essential oil of Salvia limbata C.A. Meyer Growing in Turkey. Journal of Essential Oil Research, 17, 192‒195. https://doi.org/10.1080/10412905.2005.9698872
Liston, A. (1992). Isozyme systematics of Astragalus sect. Leptocarpi subsect. Californici (Fabaceae). Systematic Botany, 17, 367‒379. https://doi.org/10.2307/2419478
Nejadhabibvash, F., Rezaei‒Chiyaneh, E., & Pirzad, A. (2017). Anatomy of Salvia limbata in relation to altitudinal gradient in West Azerbaijan (Iran). International Journal of Horticultural Science and Technology, 4(2), 205‒216
Mirza, M., Mozaffarian, V., & Nik, Z. B. (2005). Composition of the Essential Oil of Salvia limbata C.A. Mey. Journal of Essential Oil Research, 17(1), 10‒11. https://doi.org/10.1080/10412905.2005.9698815
Palkovacs, E.P., & Post, D.M. (2009). Experimental evidence that phenotypic divergence in predators drives community divergence in prey. Ecology, 90, 300–305. https://doi.org/10.1890/08-1673.1
Podani, J. (2000). Introduction to the Exploration of Multivariate Biological Data. Leiden
Rechinger, K.H. (1982). Labiatae in Flora Iranica, Akademische Druck‒u Verlagsanstalt. Astria.
Saeidnia, S., Gohari, A.R., Malmir, M., Moradi‒Afrapoli, F., & Ajani, Y. (2011). Tryptophan and Sterols from Salvia limbata. Journal of Medicinal Plants, 10(37), 41‒47.
Sheidai. M., Afshar F., Keshavarzi M., Talebi S.M., Noormohammadi Z., & Shafaf T. 2014. Genetic diversity and genome size variability in Linum austriacum (Linaceae) populations. Biochemical Systematics and Ecology, 57, 20‒26. https://doi.org/10.1016/j.bse.2014.07.014
Stace, C.A. (1989). Plant Taxonomy and Biosystematics, Edward Arnold.
Talebi, S.M., Atri, M., Sheidai, M., Sharifnia, F., & Noormohammadi, Z. (2014). Infraspecific variations in Linum album based on the determination of special stations approach in Iran. Phytologia Balcanica, 20(1), 9-22.
Talebi, S.M., Rezakhanlou, A., & Matsyura, A. (2017). Do we have infraspecific taxa of Salvia multicaulis Vahl (Lamiaceae) in Iran? Ukrainian Journal of Ecology, 7(4), 432–439. https://doi.org/10.15421/2017_138
Violle, C., Enquist, B.J., McGill, B.J., Jiang, L., Albert, C.H., Hulshof, C., Jung, V., & Messier, J. (2012). The return of the variance: intraspecific variability in community ecology. Trends in Ecology & Evolution, 27(4), 244–252. https://doi.org/10.1016/j.tree.2011.11.014
West‒Eberhard, M.J. (1989). Phenotypic plasticity and the origins of diversity. Annual Review of Ecology and Systematics, 20, 249–278. https://doi.org/10.1146/annurev.es.20.110189.001341
Whitkus, R. (1992). Allozyme variation within the Carex pachystachya complex (Cyperaceae). Systematic Botany, 17, 16‒24. https://doi.org/10.2307/2419060

Citation:
Talebi, S.M., Yadegari, P. Behzadpour, & Matsyura, A. (2019). Infraspecific morphological variations of Salvia limbata in Iran. Acta Biologica Sibirica, 5 (1), 113–121.
Submitted: 13.12.2018. Accepted: 25.01.2019
 http://dx.doi.org/10.14258/abs.v5.i1.5209

© 2019 by the authors. Submitted for possible open access publication under the terms and conditions of the Creative Commons Attribution (CC BY) license (http://creativecommons.org/licenses/by/4.0/).